NDIS provider marketing budget
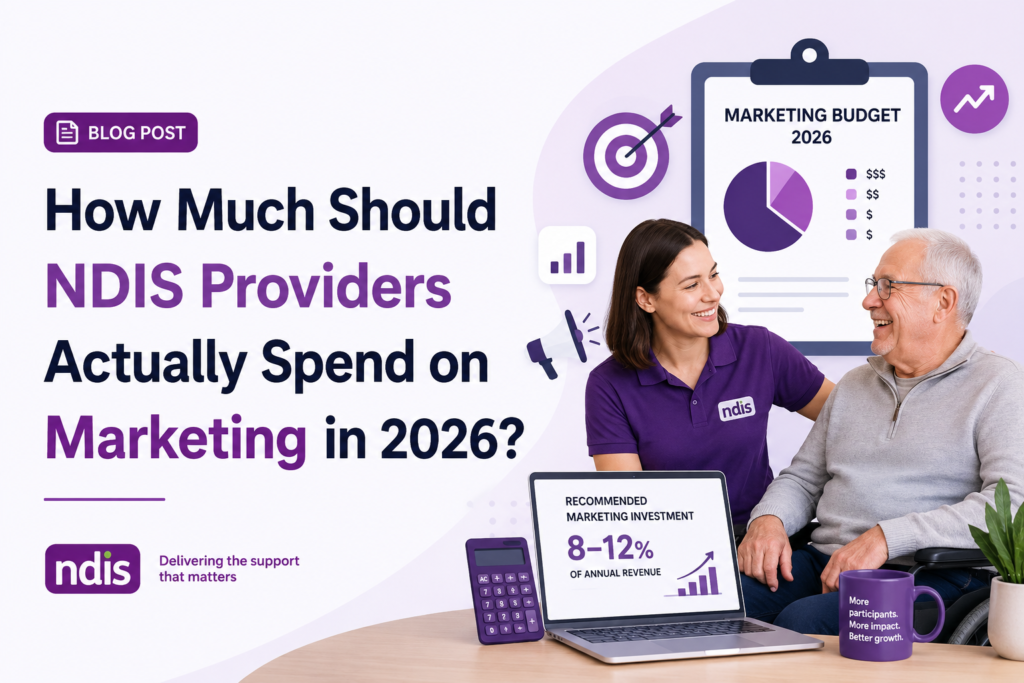
How Much Should NDIS Providers Spend on Marketing in 2026?
By Anshul Kuntewar · Founder, RouteRush Digital Marketing · Last updated: July 2026 · 11 min read
If you run an NDIS provider business and you're asking this question, you're already ahead of most of the market — because most providers aren't asking it at all. They're running on referrals and hoping the pipeline holds.
Here's the reframe worth sitting with: your NDIS provider marketing budget isn't a cost line to minimise. It's a customer acquisition lever with a measurable return — and in a market of over 21,000 registered providers where no single operator holds more than a sliver of share, the founders treating it that way are the ones pulling ahead.
This isn't a "5 social media tips" post. It's a framework for treating this as a capital allocation decision, the same way you'd think about hiring your next support worker or opening a second location.
- Why This Question Has No Industry-Standard Answer
- The Budget Framework — By Growth Stage
- Why Margin Structure Should Change Your Number
- Where the Budget Should Actually Go
- The Price-Cap Reality Nobody's Saying Out Loud
- A Simple Way to Calculate Your Own Number
- What Under-Investing Actually Costs You
- Frequently Asked Questions
Why This Question Has No Industry-Standard Answer
Retail has a marketing-spend benchmark. SaaS has one. NDIS doesn't — and there's a structural reason why.
$45 billion — the size of the NDIS provider industry in Australia in 2026, growing at a compound annual rate above 5% since 2020. IBISWorld, 2026
21,734 registered providers compete nationally, with no single operator holding more than a small share of the market. NDIS provider registry data, 2025
Support coordination margins run 40–60%, plan management 30–50%, and direct support delivery 20–40% — a spread that should directly shape where your marketing dollars go. VCCG NDIS Business Profitability Analysis, 2025
$37.8 billion in projected federal savings over four years under the 2026–27 Budget reforms, driven by tighter eligibility and standardised assessments — changing the competitive landscape for every provider. Federal Budget 2026–27
That fragmentation cuts two ways for you as a founder. The upside: market share is genuinely winnable, because nobody has locked up search visibility or brand trust at scale the way a handful of large groups have in aged care. The downside: you can't just copy a competitor's ad spend, because there's no published, proven playbook for this sector the way there is in retail or professional services.
So the right approach isn't "match what others spend." It's building your number from your own revenue, margin structure, and growth stage.
The Budget Framework — By Growth Stage, Not Guesswork
Early-Stage Providers (Under 2 Years, Building Referral Base)
Target: 10–15% of revenue. At this stage your constraint isn't conversion — it's discovery. Support coordinators and families can't choose you if they've never found you. This is the phase where under-investing compounds the longest: every month without a functioning digital presence is a month spent invisible while a better-found competitor absorbs the enquiry instead.
Established Providers (Steady Client Base, Filling Capacity)
Target: 5–8% of revenue. You're past pure survival. The goal shifts from "get found at all" to "get found consistently, and convert more of what's already arriving." This is usually the exact point where founders start asking the question this article answers — because the ad-hoc marketing that got you here won't scale you further.
Mature, Multi-Location Providers (Expanding, Strong Brand Trust)
Target: 3–6% of revenue. Spend efficiency matters more than spend volume now. You're optimising conversion and expanding into new service areas rather than building brand awareness from zero.
Benchmarking Against General B2B Growth-Stage Spend
These ranges aren't invented in isolation. Across B2B and service businesses broadly, growth-stage companies allocate meaningfully more of revenue to marketing than mature ones — often 15–25% at the earliest stages, tapering to 5–7% once a business shifts into efficiency mode. NDIS providers sit at the conservative end of that curve because of price-cap constraints, but the shape holds: spend more to grow, spend less to sustain.
Why Margin Structure Should Change Your Number
Not all NDIS revenue is created equal, and this is where generic marketing advice falls apart for this sector specifically.
| Service Type | Typical Margin | Marketing Priority |
|---|---|---|
| Support coordination | 40–60% | Highest — fastest payback per client |
| Plan management | 30–50% | High — strong, scalable payback |
| Direct support delivery | 20–40% | Moderate — longer payback window |
If your business runs a mix of these service lines, your marketing budget shouldn't be spread evenly — it should be weighted toward whichever line gives you the fastest, highest-margin payback per acquired client. That's not just higher-margin in the abstract; it de-risks your entire acquisition spend, because you recover the cost faster and can reinvest sooner.
Where the Budget Should Actually Go
A common founder mistake: putting the whole budget into paid ads and skipping the foundation entirely. A more defensible allocation for most providers:
| Channel | % of Budget | Why |
|---|---|---|
| SEO & content | 40–50% | Compounds over time; keeps working after spend stops |
| Paid ads (Google/Meta) | 20–30% | Fast for filling capacity gaps or new-region launches |
| Reviews & reputation | 15–20% | Trust-driven sector — families weigh this heavily |
| Website/CRO | 10–15% | No value in traffic that doesn't convert to enquiries |
The Price-Cap Reality Nobody's Saying Out Loud
Here's the part most generic marketing advice ignores entirely: the NDIS price book caps what you can charge for most services. You cannot raise prices to absorb a wasted ad campaign the way a retail or SaaS business can.
In a price-capped market, marketing efficiency is one of the only real growth levers left besides operational cost control. Every marketing dollar that doesn't produce a client is a dollar you can never recover through pricing power — because you don't have any. That's precisely why SEO deserves the largest single share of your budget, not paid ads.
The NDIS financial benchmarking framework makes this constraint explicit — and the 2026–27 Federal Budget reforms are tightening the funding environment further through stricter eligibility and standardised assessments. As government tightens eligibility and consolidates certain service categories, smaller and mid-sized providers will increasingly need to differentiate on visibility, trust, and direct participant relationships — rather than relying on scheme growth to carry demand automatically.
A Simple Way to Calculate Your Own Number
Rather than picking a percentage in the abstract, run this quick calculation:
- Set your target: how many new clients do you need this year to hit your growth goal?
- Know your client value: what's the average annual revenue per client, weighted by your service mix?
- Set an acceptable CAC ratio: most service businesses target spending no more than 15–20% of a client's first-year value to acquire them.
This is the version of "how much should I spend" that actually holds up in a board conversation or a bank loan application, because it's tied to a growth target rather than a feeling.
What Under-Investing Actually Costs You
Founders who spend nothing on marketing aren't saving money — they're paying for it differently: relying entirely on word-of-mouth in a market of over 21,000 competing providers, most of whom now have at least a basic Google presence. With over 21 million active social media users in Australia — roughly 82% of the population — digital discovery isn't optional anymore. It's the default first touchpoint for a growing share of your prospective clients.
"Providers are not using the price cap as an upper bound — they're using it as the going rate." — Independent Pricing Committee, 2025 report
Because so few NDIS providers treat marketing as a deliberate investment, the ones who do — with a real budget tied to a growth target, weighted toward their highest-margin services — stand out immediately in a fragmented, trust-driven market. Being invisible online is, without question, the most expensive option available to you.
Want a Founder-Level Breakdown for Your Business?
We'll map your specific budget based on your service mix, margins, and growth target — and show you exactly where each dollar should go.
Get a Free NDIS Marketing Audit →Frequently Asked Questions
Is 5% of revenue enough for an NDIS provider's marketing budget?
For an established provider with a stable referral base, yes — provided it's weighted toward SEO and reputation-building rather than ads alone. Early-stage providers building visibility from zero typically need to spend more.
Should NDIS providers prioritise SEO or paid ads?
SEO delivers better long-term value because it compounds and keeps generating enquiries after a campaign ends, whereas paid ads stop the moment spend stops. Most founders get the best return from a mix weighted toward SEO.
Does NDIS price-cap regulation affect marketing spend rules?
No. The price book governs what you can charge participants for services — it has no bearing on internal business costs like marketing, which remains a standard operating expense.
How long before NDIS marketing spend shows a measurable return?
Most providers see meaningful movement in enquiries within 3–6 months of consistent SEO and content investment, with local, lower-competition search terms often moving faster.